Figures from "The Massachusetts Experiment: The Role of the Environment in Collection Preservation"
Figure 1 (page 140). This graph charts the management of dew point by mechanical system over the course of a year.
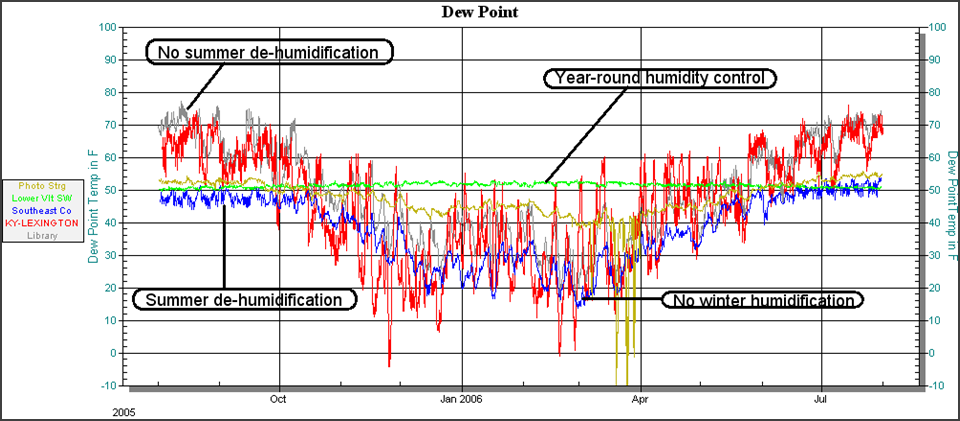
Figure 2 (page 141). This graph shows temperature and relative humidity in five Massachusetts locations over the course of a year.
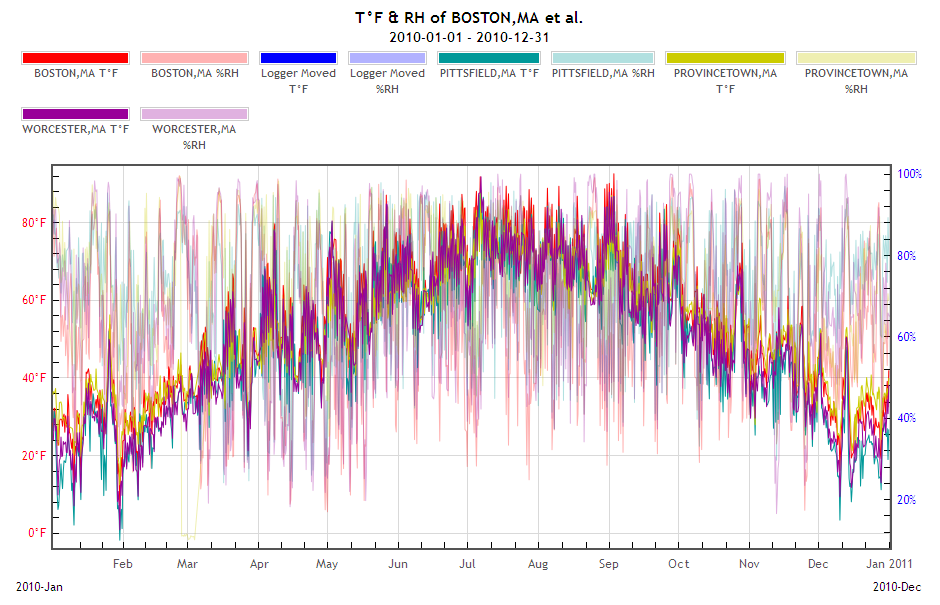
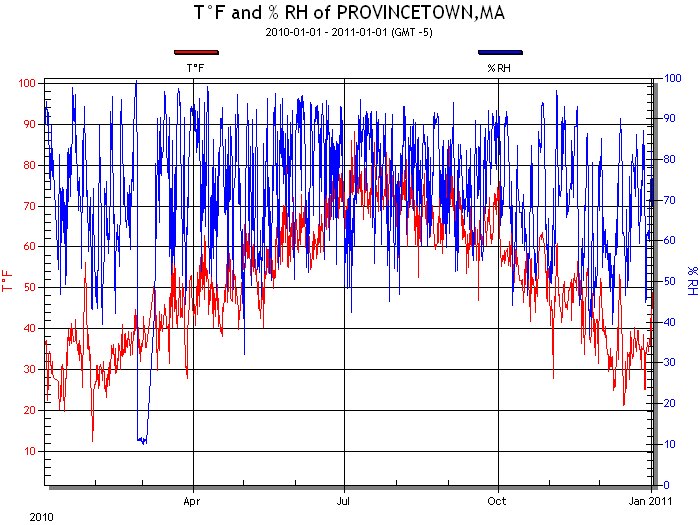
Figure 4 (page 144). This graph shows the outdoor temperature and relative humidity in Provincetown in 2010.
Updated: 2014-04-23