- About Archives
- About SAA
- Careers
- Education
- Publications
- Advocacy
- Membership
In the second of our series exploring the results of a survey issued last fall on behalf of the SAA-ACRL/RBMS Joint Task Force on the Development of Standardized Statistical Measures for Public Services in Archival Repositories and Special Collections Libraries, we delve here into questions of patron-centered metrics. These posts are intended to prime some of the thinking about how we, as a profession, currently collect, work with, and think about data in a public services context.
Regarding the collection of patron-centered data, a few themes emerged in the qualitative responses in this section of our survey:
Three forces, sometimes in combination, seem to drive Public Services collection of patron-centered data: external administrative pressures, inertia that is supported by systems, policies, or procedures, and, rarer, an internal sense that data collection can provide actionable insights.
When the data-collection driver is primarily administrative, only the specific metrics requested of the department are actively gathered and the efforts to collect are abandoned if administrative requests are not consistently issued. This seems particularly true of demographic patron data.
Repositories are concerned about how to capture and reflect what is different
about archival and special collections patron services as compared to other kinds of libraries.
There is a strong will to collect data on the staff time involved in patron service as a complement to basic counts of services provided, but few do or feel that they can because of the effort involved in doing so.
Repositories responding to the survey are likely to count the number of users who physically enter the repository for any reason.
| We count this | 182 | 65.2% | 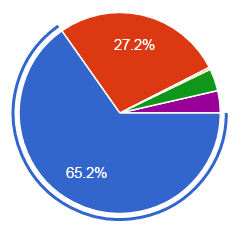 |
| We do not count this | 76 | 27.2% | |
| We sometimes take samples | 10 | 3.6% | |
| Not applicable to my institution | 10 | 3.6% |
About 80% of respondents indicate that this is a useful and meaningful metric for them.
Repositories are even more likely to count the number of users who use collection material in a reading room (or other designated space). It is notable perhaps that 10% of repositories do not count this or indicated that it was not applicable to their institution.
We count this |
246 |
88.2% |
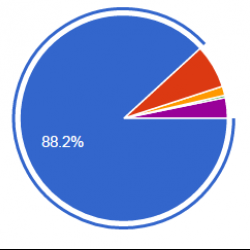 |
We do not count this |
19 |
6.8% |
|
Not applicable to my institution |
9 |
3.2% |
94% of respondents indicate that this is a useful and meaningful metric for them.
Repositories were much less likely to capture the length of time users spend in a reading room than they were to capture their presence in a reading room (or similar).
| We do not count this | 181 | 65.1% | 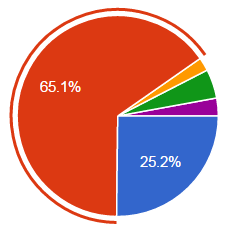 |
| We count this | 70 | 25.2% | |
| We sometimes take samples | 13 | 4.7% | |
| Not applicable to my institution | 8 | 2.9% | |
| I don't know | 6 | 2.2% |
Just under half of respondents indicate that this is a useful and meaningful metric for them. The range of feeling about the importance of this metric was the most distributed of any we asked out in the patron information section of our survey.
Repositories were very likely to count the number of remote interactions they had with users. These are patrons who do not physically enter a repository and communicate rather via phone, email, social media, or other means.
| We count this | 253 | 91% | 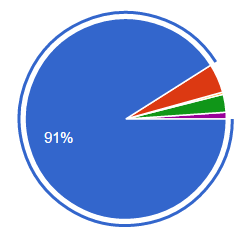 |
| We do not count this | 13 | 4.7% | |
| We sometimes take samples | 8 | 2.9% | |
| Not applicable to my institution | 3 | 1.1% |
Interestingly, there was the most comprehensive agreement at 97% that this was an important metric to gather.
Regarding demographic information about users (e.g. internal or external, office or department, student, genealogist) a majority of repositories did capture this information.
| We count this | 206 | 74.6% | 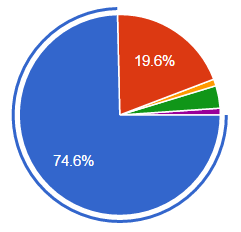 |
| We do not count this | 54 | 19.6% | |
| We sometimes take samples | 10 | 3.6% | |
| Not applicable to my institution | 3 | 1.1% | |
| I don't know | 3 | 1.1% |
85% of respondents indicate that this is a useful and meaningful metric for them. Generally repositories that do collect some kind of demographic data also tend to divide “internal” or “affiliated” users from non-affiliates. Affiliated user status seems to prompt a majority of repositories to drill down deeper on the particulars of that user’s type. This could be undergraduate/graduate/faculty division, or particular staff, agency, or business affiliations. While not a majority behavior, there was also a notable trend toward collecting information on the purpose of a user’s engagement with the repository.
And don't forget to submit your comments on the proposed New Standard for Measuring Public Services by August 22, 2016.